(Reposted from the Empower Campaigns blog)
When developing an application, one of the keys to maintaining high productivity and quality is to make sure that you not only have the right tool set, but that you have easy access to it. With web applications, the usual needs are things like running Selenium tests, running unit tests and checking code coverage, profiling, and having links to documentation. Though I’ve talked previously about the cost of maintaining 100% code coverage, I’m convinced that it’s worth it if you not only get proficient at the tools, but make them very easy to use. So when I started as the first developer here at Empower Campaigns a couple of months ago, I wanted to make sure these needs were addressed early on, before we had a large development team.
 Inspired by the work that had been done at my previous job by Ian Eure and Matt Erkkila, I decided to start with the following:
- Use the tried and true GNU Make for building environments and executing tools
- Have a “build” virtual host in every development environment for accessing the tools’ web resources
Using make, getting our project “enterprise” (we use space shuttle themed project names) up and running is as simple as this:
# clone into a directory named with your vhost name:
git clone review:enterprise.git enterprise.bshupp.dev.em.power
cd enterprise.bshupp.dev.em.power
# install into apache
make clean install
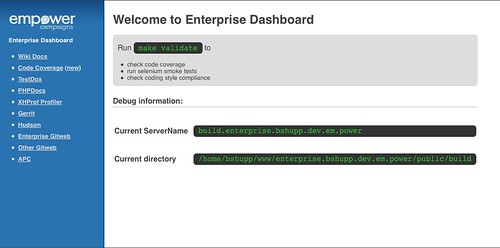
This not only provides a working application (or “shuttle” as we call them) at enterprise.bshupp.dev.em.power, but also a “build” virtual host for access to web resources at build.enterprise.bshupp.dev.em.power. Here’s a screen shot of the initial build “dashboard”, which provides navigation on the left, and some environment details and instructions on the main page.
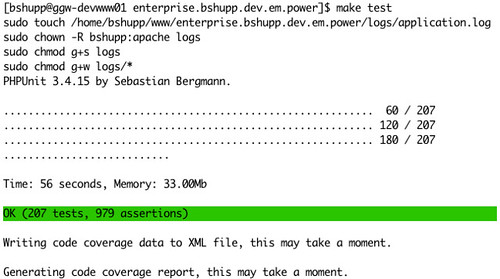
Since our web tier is in PHP, the most common tool we need to run is PHPUnit, which you run via make test. You’ll see the standard output in your terminal like so (with some nice colors indicating the status – green for success and high coverage, yellow for success and medium coverage, and red for failing tests).
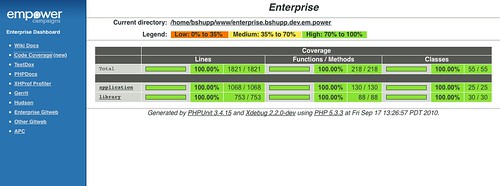
In addition, to view coverage details, you go to the “code coverage” link your build dashboard.
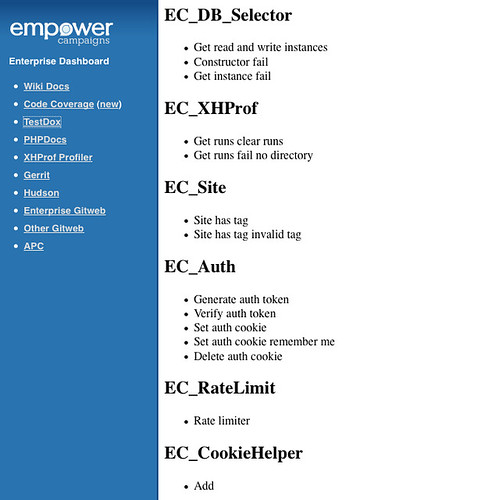
make test also generates TestDox output to see which tests are failing.
We keep a Selenium Remote Control (RC) server running on our development system for easy access by developers. Want to see if you’ve broken the selenium tests? Just run make selenium-smoke or make selenium-full, and Selenium RC will talk to your development environment.
And since developers need to run make test selenium-smoke phpcs to validate before any push to avoid breaking a build, I’ve wrapped them up into make validate for convenience. We actually use these shortcuts with Hudson, which allows us to direct Selenium RC to different staging environments, or modify build steps without re-configuring Hudson.
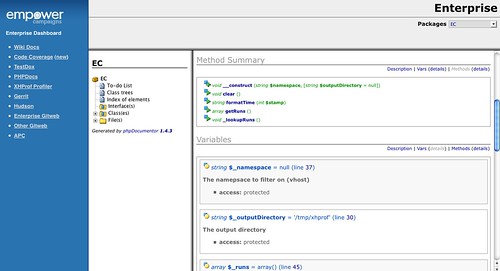
Want to read the inline documentation in a web browser instead of your text editor? Just run make phpdoc, then click on the “PHPDocs” link in the build dashboard.
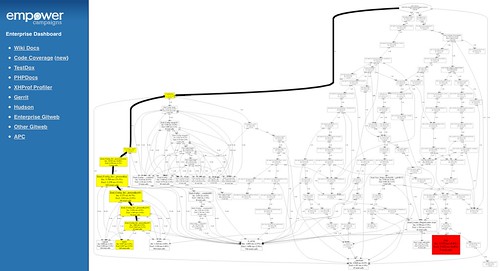
One thing that’s particularly useful is easy profiling with Facebook’s XHProf. Just enable profiling in your environment via make enable-profiling, perform the action in the application you want to profile, then open up the “XHProf Profiler” link in your build dashboard. There you’ll see a list of “runs” which you can drill down into and see exactly how each is performing. When you’re done, just run make disable-profiling.
To manage XHProf profile runs, I save them by environment, and wrote a helper that allows you to browse runs by date, and then “clean” them out when you’re done. This works easily in a shared xhprof.output_dir by namespacing the stored runs according to environment name. Here is the example snippet for starting profiling and saving as runs:
And you can checkout the full code over on github.
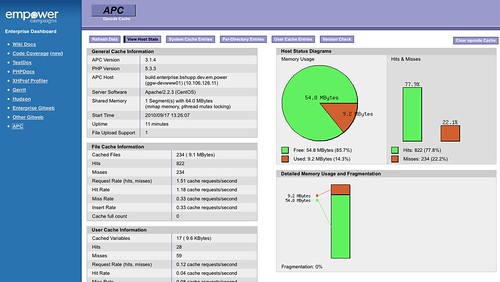
If you want to get statistics on or content from APC, that’s available too through the inspector that ships with the extension:
Lastly, I’ve also included links in the dashboard to all the tools we use: our Confluence wiki, Gerrit, gitweb, and Hudson.
This system makes it really convenient to deploy your development environment, access documentation, profile your code, run test tools and analyze results. It’s my hope that as our development team grows, it’ll be relatively painless to maintain high quality, well tested code.
Cheers,
Bill Shupp, Lead Developer (twitter: http://twitter.com/shupp)
Leave a Reply